使用 Java 画六维图
用 java 手画六维图
介绍
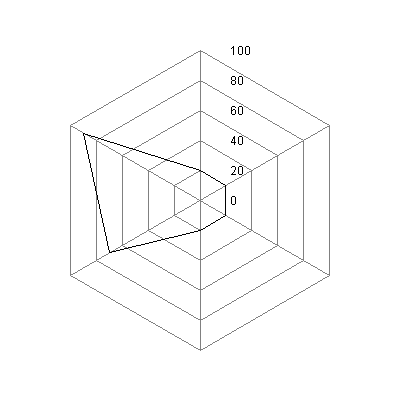
我们项目需要在使用数据动态的生成一张六维图,宏观的展示数据的状态。 所以,我就动手实现了一个通过数据生成 六维图 的代码。
只需要修改部分代码就可以做到生成 任意维度的图 。
代码
- 通过一个顶点画一个正六边形
    public Graphics2D drawRadar(Graphics2D backG, int x, int y, int length){
        backG.drawLine(x, y, (int) (x + (length/2 * 1.732)), y + (length/2));
        backG.drawLine((int) (x + (length/2 * 1.732)), y + (length/2), (int) (x + (length/2 * 1.732)), y + (length/2) + length );
        backG.drawLine( (int) (x + (length/2 * 1.732)), y + (length/2) + length , x, y + (length * 2));

        backG.drawLine(x, y + (length * 2), (int) (x - (length/2 * 1.732)), y + (length/2) + length);
        backG.drawLine((int) (x - (length/2 * 1.732)), y + (length/2) + length, (int) (x - (length/2 * 1.732)), y + (length/2));
        backG.drawLine((int) (x - (length/2 * 1.732)), y + (length/2),x, y);

        return backG;
    }
- 通过一个顶点画六边形中的对角连的连线
    public Graphics2D drawRadarLine(Graphics2D backG, int x, int y, int length){
        backG.drawLine(x, y, x, y + (length * 2));
        backG.drawLine((int) (x + (length/2 * 1.732)), y + (length/2), (int) (x - (length/2 * 1.732)), y + (length/2) + length );
        backG.drawLine( (int) (x + (length/2 * 1.732)), y + (length/2) + length , (int) (x - (length/2 * 1.732)), y + (length/2));
        return backG;
    }
- 计算某一个数(g)在一条横线上的位置(百分比) 例如:g = 50, 意思是在一条横线上的位置是50%的位置,即在横线的中点。 返回值是 想要点的坐标。
    public int[] cal(int x1, int y1, int x2, int y2, int g){
        int[] res = new int[2];

        res[0] = (int) ((((x2 - x1 + 0F))/100.0) * g) + x1;
        res[1] = (int) ((((y2 - y1 + 0F))/100.0) * g) + y1;
        return res;
    }
- 用以上方法画六维图,并输出到 png 文件中
    public void draw(String outFilePath, int[] g) throws IOException {
        int width = 400, height = 400;
        //创建图片对象
        BufferedImage image = new BufferedImage(width, height, BufferedImage.TYPE_4BYTE_ABGR);
        File outFile = new File(outFilePath);

        // 假如目标路径不存在,则新建该路径
        if (!outFile.getParentFile().exists()) {
            outFile.getParentFile().mkdirs();
        }

        // 假如目标文件不存在,则新建该文件
        if (!outFile.exists()) {
            outFile.createNewFile();
        }
        int x = 200;
        int y = 50;
        int length = 150;
        Graphics2D backG = image.createGraphics();
        backG.setColor(Color.GRAY);
        backG = drawRadarLine(backG,x,y,length);
        for (int i = 0; i < 5; i++){
            backG = drawRadar(backG,x,y + (i * 30),length - (i * 30));
        }
        backG.setColor(Color.BLACK);
        for (int i = 0; i < 6; i++){
            backG.drawString(i*20+"",x+30, y + (i * 30) + ((length - (i * 30)) * 2)  -  length + 5 );
        }
        backG.setColor(Color.BLACK);
        int x0 = x;
        int y0 = y + length;
        int[] d1 = cal(x0, y0, x, y, g[0]);
        int[] d2 = cal(x0, y0, (int) (x + (length/2 * 1.732)), y + (length/2), g[1]);
        int[] d3 = cal(x0, y0, (int) (x + (length/2 * 1.732)), y + (length/2) + length, g[2]);
        int[] d4 = cal(x0, y0, x, y + (length * 2), g[3]);
        int[] d5 = cal(x0, y0, (int) (x - (length/2 * 1.732)), y + (length/2) + length, g[4]);
        int[] d6 = cal(x0, y0, (int) (x - (length/2 * 1.732)), y + (length/2), g[5]);
        int[][] dd = new int[][]{d1,d2,d3,d4,d5,d6};
        for (int i = 0; i< dd.length-1; i++){
            backG.drawLine(dd[i][0], dd[i][1], dd[i+1][0], dd[i+1][1]);
        }
        backG.drawLine(dd[dd.length-1][0], dd[dd.length-1][1], dd[0][0], dd[0][1]);
        backG.dispose();
        ImageIO.write(image, "png", new File(outFilePath));
    }
实现效果